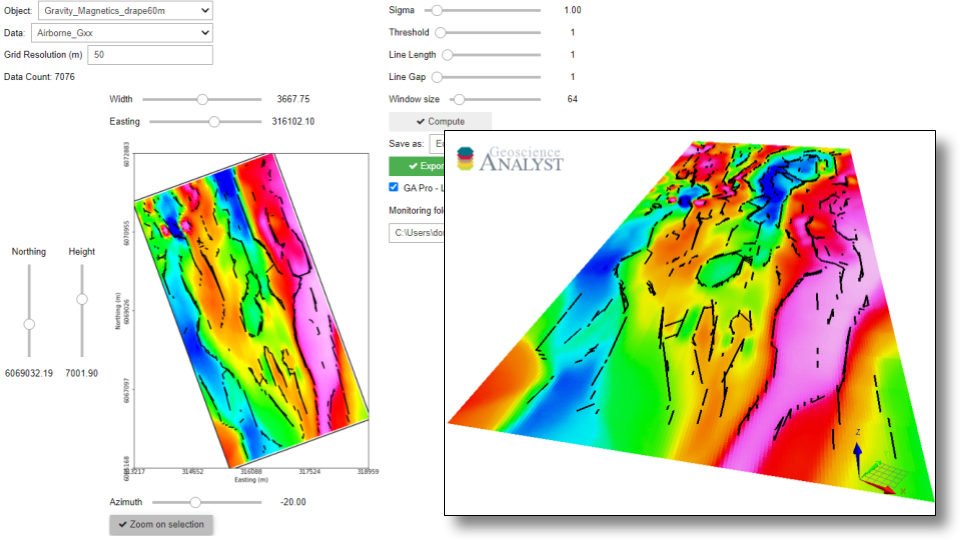
Edge Detection
With this application, users can create lines along edges (lineaments) from gridded data in a semi-automated fashion. The application uses machine vision algorithms from the Scikit-Image open-source package.
Currently available for Grid2D objects.
Edges can be exported to Geoscience ANALYST for viewing and editing.
See the Methodology section for algorithmic details
Video tutorial available on Youtube
New user? Visit the Getting Started page.
Application
The following sections provide details on the different parameters controlling the application. Interactive widgets shown below are for demonstration purposes only.
[1]:
from geoapps.edge_detection.application import EdgeDetectionApp

app = EdgeDetectionApp(geoh5=r"../../../assets/FlinFlon.geoh5")
app.main
Project Selection
Select and connect to an existing geoh5 or ui.json project file containing data.
[2]:
app.project_panel
See the Project Panel page for more details.
Input Data
Object and Data Selection
List of Grid2D objects available in the target geoh5 project.
[3]:
app.data_panel
Window selection
Select a subset of the input Grid2D.
[4]:
app.window_selection
See the Map View Selection page for more details.
Canny Edge Parameters
Parameters controling the Scikit-Image.feature.Canny edge detection routine.
Hough Line Parameters
Parameters controling the Scikit-Image.transform.probabilistic_hough_line routine.
Window size
Window size (square) used for the tiling of the data (see the Methodology section)
[9]:
app.window_size
Output Panel
Trigger the computation routine and store the result.
[10]:
app.output_panel
See the Output Panel page for more details.
Methodology
The conversion from raster data to lines involves the following four main processing steps.
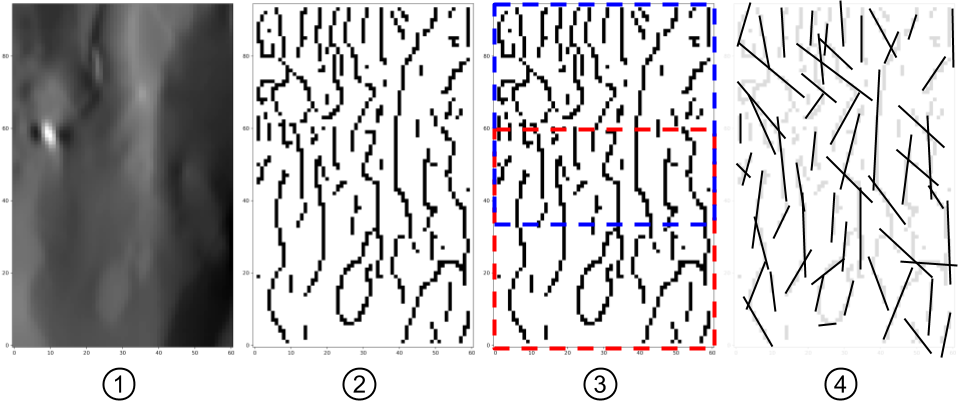
The selected gridded data are normalized between [0, 1]
Normalized values are processed with the Canny edge detection algorithm.
The full grid is sub-divided into overlapping square tiles defined by the window size parameter. Tiling is used to speed up computations and reduce skews in the Hough line parametrization observed on grids with small aspect ratios.
For each tile, edges are converted to a line parametric form using the Hough Line Transform.
Need help? Contact us at support@mirageoscience.com