Contours
With this application, users can create contours from data stored on points, curve, surface or grid objects. The application relies on the matplotlib.pyplot contouring routines. The result can be exported to Geoscience ANALYST as either 2D or 3D curves.
New user? Visit the Getting Started page.
Video tutorial available on Youtube
Application
The following sections provide details on the different parameters controlling the application. Interactive widgets shown below are for demonstration purposes only.
[1]:
from geoapps.contours.application import ContourValues

app = ContourValues(geoh5=r"../../../assets/FlinFlon.geoh5")
app.main
Project Selection
Select and connect to an existing geoh5 or ui.json project file containing data.
[2]:
app.project_panel
See the Project Panel page for more details.
Object/Data Selection
List of objects available to pull data from.
[3]:
app.data_panel
See the Object Selection page for more details.
Contour selection
Numerical values or range of values to draw contours at. Define a list of fixed contours with the Fixed contours parameter. Define a range of contours with the Contour min, Contour max, and Contour spacing parameters.
[4]:
app.contours
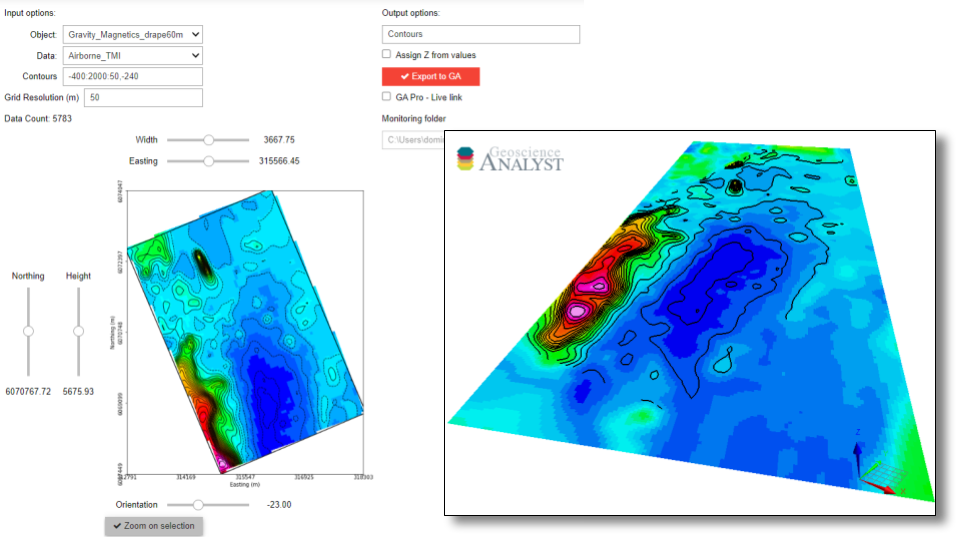
Window Selection
Manual selection of an area of interest and data resolution. Positive (solid) and negative (dash) contour lines are traced immediately after changes made to the contour values.
[5]:
app.window_selection
See the Map View Selection page for more details.
Output panel
Contours can be exported directly to the target workspace by clicking on the export button. This can yield two possible outcomes:
If no curve object is present with the same name, a new curve object is created.
If a curve object is found with the same name, vertices and line segments are changed in place. This allows users to quickly experiment with different contour levels without having to delete previous trials.
[6]:
app.output_panel
(Optional) Geoscience ANALYST Pro - Live link
See Output Panel base applications.
Need help? Contact us at support@mirageoscience.com