Data Transfer
This application lets users transfer data between any two objects.

New user? Visit the Getting Started page.
Application
The following sections provide details on the different parameters controlling the application. Interactive widgets shown below are for demonstration purposes only.
[1]:
from geoapps.interpolation.application import DataInterpolation
app = DataInterpolation(geoh5=r"../../../assets/FlinFlon.geoh5")
app()
Project Selection
Select and connect to an existing geoh5 or ui.json project file containing data.
[2]:
app.project_panel
See the Project Panel page for more details.
Source Object/Data
List of objects available. Currently supports objects of type Points, Curve, Surface and Grid2D
[3]:
app.data_panel
Interpolation Parameters
List of additional parameters controlling the interpolation routine.
[5]:
app.parameter_choices
Method
Type of routine used to interpolate values.
[6]:
app.method
Nearest
Use the nearest neighbors between the Source and Destination objects (vertices or centroids). Uses Scipy.spatial.cKDTree
Linear
Use a Delaunay triangulation from Scipy.interpolate.LinearNDInterpolator.
Beware of memory and speed limitations related to 3D triangulation.
Inverse Distance
Weighted inverse distance averaging defined as:
\begin{equation} d_j = \frac{\sum_{i=1}^8 d_i \; r_i^{-1}}{\sum_{i=1}^8 r_i^{-1}} \end{equation}
where \(r_i\) is the radial distance between the \(j^{th}\) vertex/centroid to its \(i^{th}\) nearest neighbor. Eigth neighbours are used by default.
(Optional) Skew parameters
Exaggerate the inverse distance interpolation along a set direction. Useful when dealing with spatially elongated source objects such as 2D line models. See Example
[7]:
app.method_skew
azimuth: Angle in degree from North of source object orientation.
factor: Aspect ratio between the in-line spacing and the line separation (i.e. 25 m stations / 100 line spacing => 0.25)
Scaling
Data transformation performed before interpolating.
[8]:
app.space
Linear
Values interpolated in linear-space.
Log
Values converted to log-space before interpolation. The result is converted back to its original space (signed) after transfer. Useful for data values spanning multiple order of magnitude such as resistivity.
Horizontal Extent
Add horizontal limits to the inter/extrapolation of the data.
Maximum distance
Maximum 2D radial distance between the vertices/cells of the input and output objects. No-data-values are assigned beyond the specified distance.
[9]:
app.max_distance
(Optional) Object hull
Use the vertices/cells of a specified object to compute the horizontal extent. Usuful when transfering model values across meshes while limiting the extent of the output model to the survey area.
[10]:
app.xy_extent
Vertical Extent
Add vertical limits to the interpolation.
Maximum Depth
Maximum vertical distance (depth) between the vertices/cells of the input and output objects. No-data-values are assigned beyond the specified distance.
[11]:
app.max_depth
(Optional) Topography
Upper vertical limit of the interpolation defined by object vertices triangulated along the XY plane. A specific data field can be specified for the elevation of the vertices.
[12]:
app.topography.data_panel
No-data-value
Specify the fill value to assign vertices/cells beyond the horizontal and vertical extents.
[13]:
app.no_data_value
Output Panel
Trigger the computation routine and store the result.
[14]:
app.output_panel
See the Output Panel page for more details.
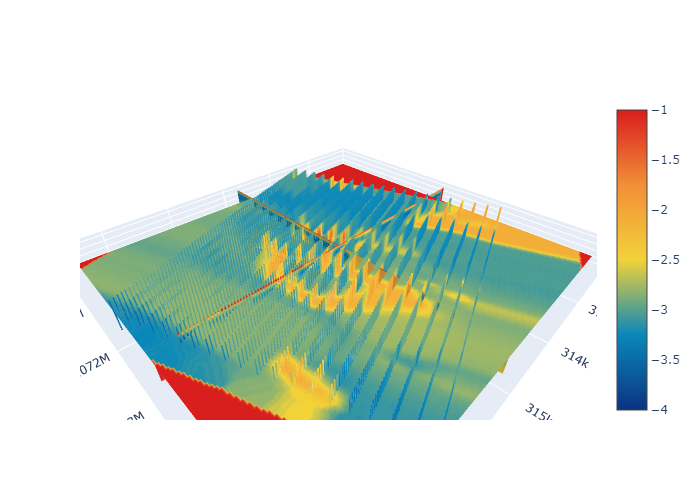
Example
[16]:
import numpy as np
from geoapps.utils.plotting import plotly_block_model, plotly_scatter
# Some plotting calls using plotly wrappers
points, data = app.get_selected_entities()
obj = app.workspace.get_entity(app.out_object.value)[0]
figure = plotly_scatter(points, color=np.log10(data[0].values), marker_scale=1, cmin=-4, cmax=-1)
figure = plotly_block_model(
obj,
value=np.log10(obj.children[0].values),
figure=figure, cmin=-4, cmax=-1
)
Need help? Contact us at support@mirageoscience.com